Chapter 6: Measurement of Antibody Affinity
Quantitative measurements of the affinity of an antibody for antigen can provide useful information about an antibody. For example, affinity measurements may be used to screen different isolates of an antibody in order to identify those that are most effective at binding antigen. Also, quantitative measurements of the capacity of an antibody to bind other compounds that are structurally related to the original immunizing antigen can help establish the likelihood of whether an antibody will crossreact, perhaps undesirably, with other molecules that might accompany the antigen. The valence of an antibody for antigen can also be found by quantitative affinity measurements, this parameter being an important distinguishing feature of different classes and subclasses of antibodies.
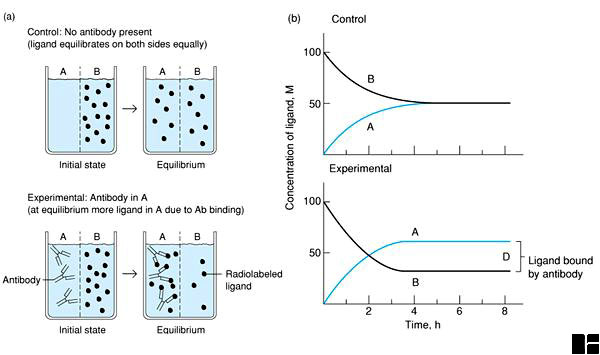
The simplest and most direct way of measuring antibody affinity is by the method of equilibrium dialysis, as illustrated in Figure 6-2 below and described in the legend.
Figure 6-2. Determination of antibody affinity by equilibrium dialysis. (a) The dialysis chamber contains two compartments (A and B) separated by a semipermeable membrane. Antibody is added to one compartment and a radiolabeled ligand to another. At equilibrium the concentration of radioactivity in both compartments is measured. (b) Plot of concentration of ligand in each compartment with time. At equilibrium the difference in the concentration of radioactive ligand in the two compartments represents the amount of ligand bound to antibody.
From measurements of the equilibrium concentrations of free and bound antigen, starting with different initial concentrations of antigen, one can apply a simple formula in order to determine the equilibrium association constant and valence of an antibody. The formula is the Scatchard equation: r/c = K(n-r):
By graphical analysis, r/c is plotted on the Y-axis versus r on the X-axis thus producing a Scatchard plot, as shown in Figure 6-3.
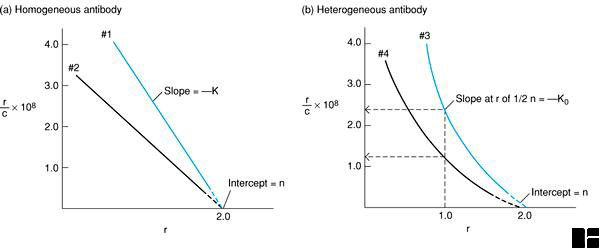
Figure 6-3. Scatchard plots are based on repeated equilibrium dialyses with a constant concentration of antibody and varying concentration of ligand. In these plots, r = moles bound ligand/mole antibody and c = free ligand. From a Scatchard plot, both the equilibrium constant (K) and the number of binding sites per antibody molecule (n), or its valency, can be obtained. (a) If all antibodies have the same affinity, then a Scatchard plot yields a straight line with a slope of -K. The Y intercept is the valence of the antibody, which is 2 for IgG. In this graph antibody #1 has a higher affinity than antibody #2. (b) If the antibodies are pooled and have a range of affinities, a Scatchard plot yields a curved line, whose slope is constantly changing. The average affinity constant K0 can be calculated by determining the value of K when one-half of the binding sites are occupied (i.e., when r = 1). In this graph antiserum #3 has a higher affinity (K0 = 2.4 x 10⁸) than antiserum #4 (K0 = 1.25 x 10⁸).
If the equilibrium reaction relates to a monoclonal antibody, the Scatchard plot will yield a straight line, as illustrated in Figure 6-3(a). In this case the equilibrium association constant for antigen, K, equals the negative slope of this line and the antibody's valence, n, or number of antigen binding sites, equals the r value at the point where the extrapolated graphical line intercepts the X-axis.
If the equilibrium reaction relates to a heterogeneous mixture of two or more antibodies recognizing the same antigen, the Scatchard plot will generally yield a curved line, as illustrated in Figure 6-3(b). In this case, the shape of the line depends on the molar ratio of different antibodies as well as their individual association constants. By definition, the average affinity, K0 = 1/c1/2, the reciprocal of the concentration of free antigen when one-half of the antigen binding sites are occupied. The average valence equals the r value at the point where the extrapolated graphical line intercepts the X-axis.
The relationships between the shapes of data lines observed on Scatchard plots, as illustrated in Figure 6-3 above, the association constants for antigen binding, and antibody heterogeneity are further explored in a dynamic Scatchard plot, created with Excel and designed so that antibody equilibrium association constants and the ratio of antibodies in a heterogeneous mixture can be incrementally adjusted with interactive "dials."
| © 1997, Duane W. Sears |